
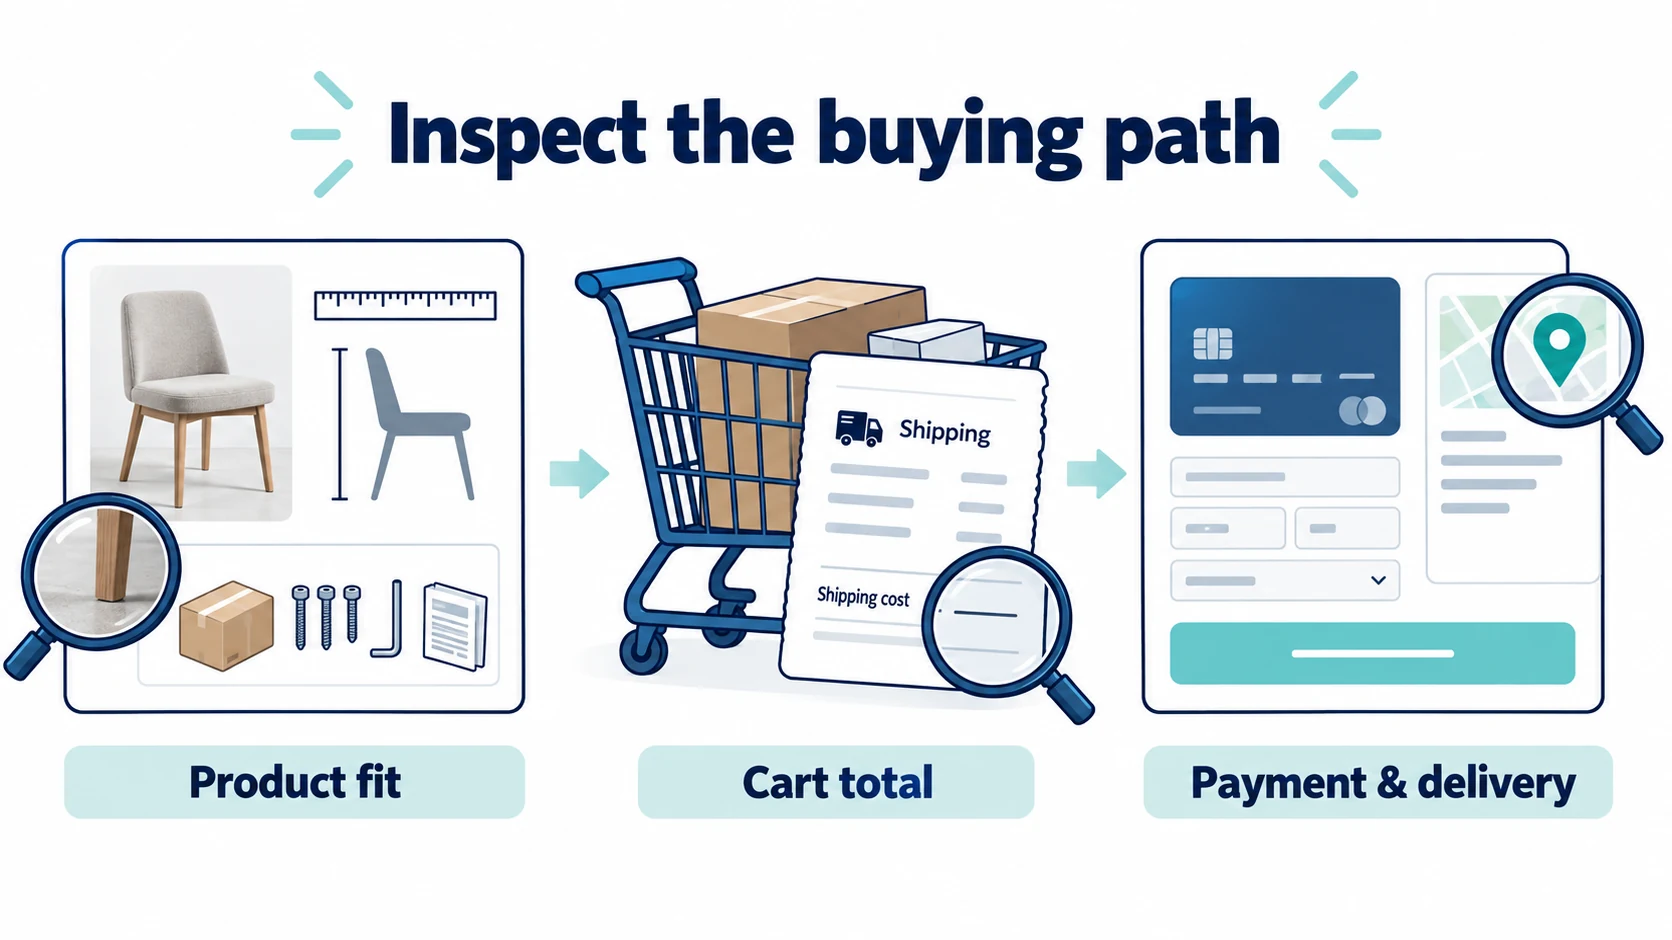
Dropshipping conversion rate tells you how often store visits become purchases. In Shopify’s online-store report, divide sessions with a purchase by total sessions, then multiply by 100. If 40 of 2,000 sessions include a purchase, the rate is 2%.
A single store percentage cannot show you where shoppers get stuck. Some may leave without adding an item; others may reach checkout and find shipping unavailable. Those problems need different fixes.
Start by checking what the report counts. Then follow the buying path, find the obstacle and make the product or delivery offer clearer before paying for more visits. The wider branded dropshipping guide covers the brand and fulfillment plan; this guide focuses on turning the right visits into orders you can afford to serve.
01
What your conversion rate counts
A session is a visit to your store. A purchase session is a visit during which the shopper buys. For Shopify’s online-store conversion metric, use:
Purchase sessions ÷ total sessions × 100
That is why 40 purchase sessions out of 2,000 total sessions gives 2%. These are illustrative numbers, not a measured result for a store.
Use purchase sessions for the session rate
Orders and people are different counts. A person can visit several times, and a session can contain more than one order. Dividing raw orders by sessions can be useful as a custom measure, but it is not always Shopify’s purchase-session rate. Dividing orders by unique visitors answers another question again.
These three rates answer different questions. For the same illustrative store:
| Rate | Calculation | What it tells you |
|---|---|---|
| Store purchase conversion | 40 purchase sessions ÷ 2,000 sessions = 2% | How often a visit includes a purchase |
| Add-to-cart rate | 160 sessions adding to cart ÷ 2,000 sessions = 8% | How often a visit reaches the cart step |
| Checkout completion | 40 purchase sessions ÷ 100 sessions reaching checkout = 40% | How often a checkout visit ends in a purchase |
On a phone, swipe the table sideways to compare every column.
Use the same dates, sales channel and traffic group for each comparison. Also check whether a funnel counts only people who follow every step in order. That is a closed funnel. An open funnel lets people enter partway through—for example, going directly to checkout. Rates from different entry rules cannot safely be multiplied into one buying path.
Why the ad dashboard may show another number
An ad platform may give credit to a purchase after a click or a view within its chosen time window. That is attribution: deciding which marketing touch gets credit. Your store’s session report is counting visits and purchases under its own rules.
Check the date window and attribution model when comparing them. Shopify’s marketing reporting guidance explains these differences. Do not add overlapping ad-platform credits together and assume the total equals distinct store orders.
02
What makes a rate good for your store?
There is no single conversion target that suits every product and traffic mix. An expensive purchase can involve several visits before a decision. A returning customer already knows the store. A new shopper from a broad ad may need far more information.
Start with your own comparable visits. Look at the product or landing page, traffic source, country, device and new versus returning customers. Comparing the same group over time is more useful than treating an unrelated store’s percentage as a target.
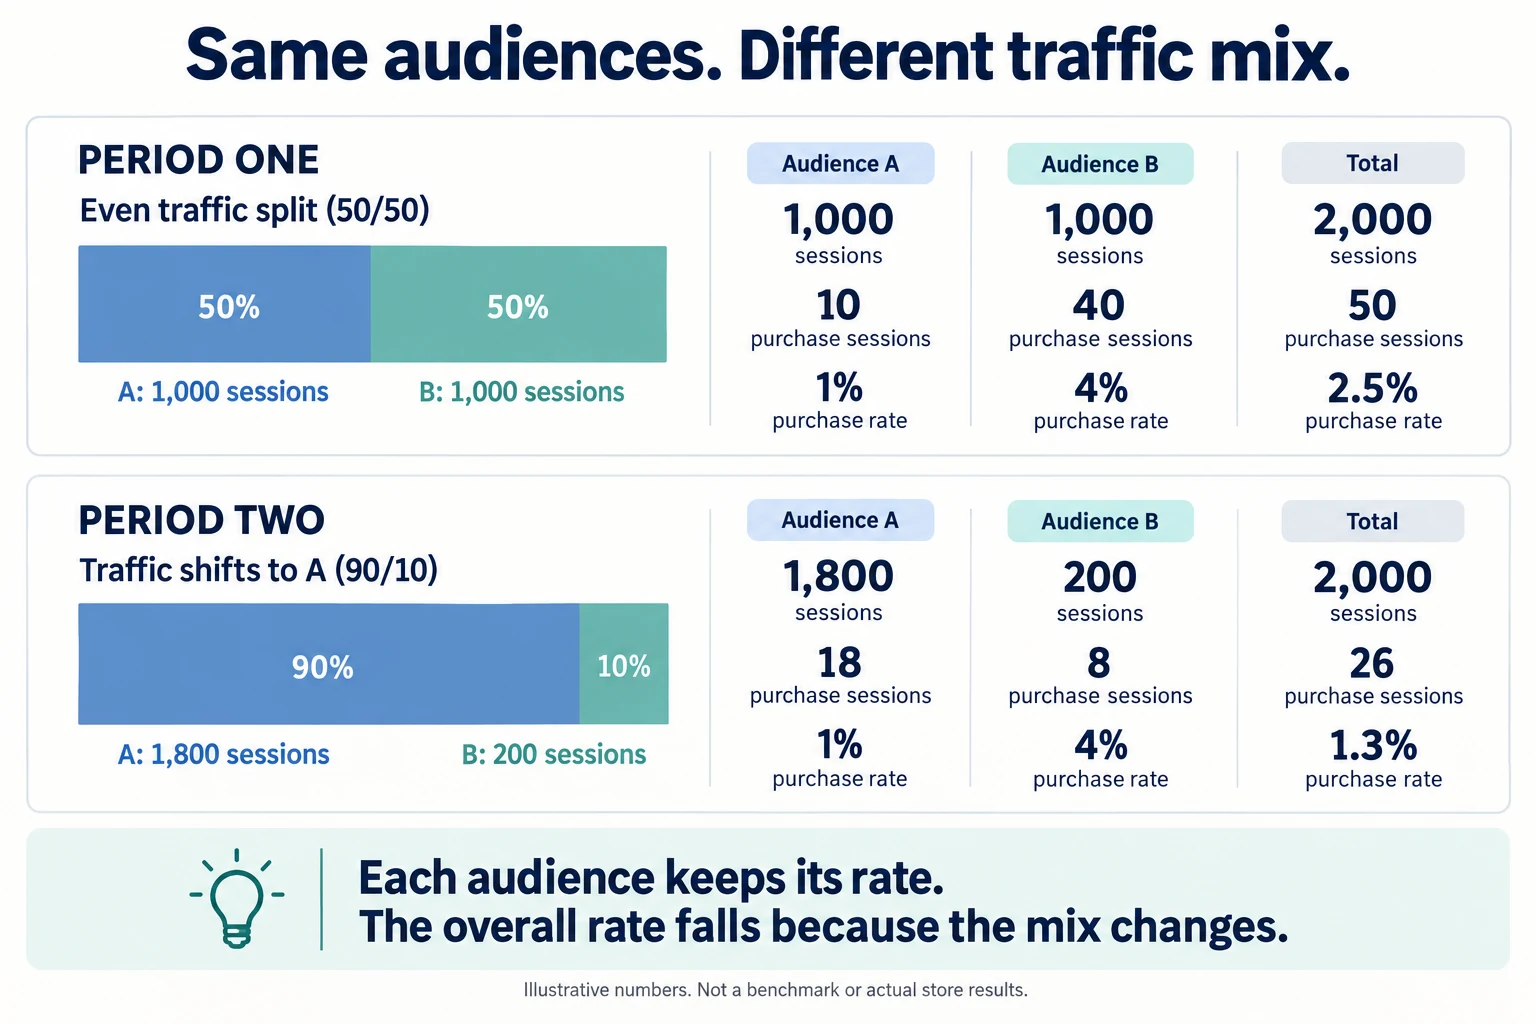
A whole-store rate can fall even if each audience buys at the same rate. Changing the balance between audiences is enough. The following invented numbers show why comparing traffic groups matters.
Same audiences, different proportions
Call two comparable traffic groups A and B. A has a 1% purchase-session rate; B has 4%. These are teaching inputs, not benchmarks or results from an actual store.
Period one: an even split
A has 1,000 sessions and 10 purchase sessions. B has 1,000 sessions and 40 purchase sessions. Together that is 50 purchase sessions in 2,000 sessions: a 2.5% whole-store rate.
Period two: more of group A
A has 1,800 sessions and 18 purchase sessions. B has 200 sessions and eight purchase sessions. Together that is 26 purchase sessions in 2,000 sessions: a 1.3% whole-store rate.
What changed?
A still converts at 1% and B at 4%. The store now receives more of the lower-converting group. The combined decline alone cannot show that the product page got worse.
Compare each group under the same counting rules before choosing a page change. Investigate why the traffic proportions changed, then inspect the actual buying path. A page problem can still exist; this example only shows why the combined percentage does not establish it.
A benchmark needs comparable counting rules
A published benchmark needs its counting method, time period and traffic mix before it can help. Product sales volume alone cannot reveal conversion without a compatible visit count. Do not treat a seller’s units sold as evidence of a store-wide purchase rate.
The money also matters. A discount may persuade more people to buy while leaving less from each order. Judge the rate alongside completed orders, refunds and the amount left after goods, delivery, fees and advertising. A larger percentage is useful when the resulting orders are worthwhile for your business.
03
Check that the report is counting visits the same way
Before rewriting the store after a sudden change, check the report. Shopify rolled out a session measurement update on September 21–23, 2026. Three changes can affect comparisons:
- Midnight no longer splits an ongoing visit into separate sessions.
- Some sessions without a recorded pageview are now included.
- Identified bot traffic is filtered out by default.
A session still ends after 30 minutes of inactivity. Because the visit count can change, the conversion percentage can move even when orders, sales and customers have not. A change around those dates is not, by itself, proof that shoppers became more or less willing to buy.
Use a new baseline with the same settings after the update, and check human-versus-bot filters when comparing reports. Avoid treating a pre-update session count and a post-update count as perfectly equivalent.
Other tracking differences deserve a look, too: consent settings, duplicate or missing purchase events, different time zones and a custom storefront that sends events differently. Follow a genuine test checkout under your store’s testing process and verify that the expected purchase event is recorded once.
A report problem needs a measurement check
If real paid orders are steady but reported purchase sessions suddenly collapse, investigate measurement first. If paid orders also fall, check the affected country, device and buying path. Neither pattern proves a cause on its own, but it helps you choose what to examine before spending time on a redesign.
04
Find the step where shoppers stop
Imagine an illustrative closed funnel in which the visits below follow the same steps in order: 2,000 store sessions, 160 adding to cart, 100 reaching checkout and 40 purchasing.
The store rate is 40 ÷ 2,000 = 2%. Of all visits, 8% reach the cart. Of those cart visits, 62.5% reach checkout. Of checkout visits, 40% purchase. Those separate numbers show where to look next.
| Where the path weakens | What to check | A useful first fix, if you find the problem |
|---|---|---|
| Few visits add a product | Does the ad match the item? Are the variant, dimensions, included parts and price clear? | Make the offer match the ad and answer the missing product question |
| Carts do not reach checkout | Shipping charges, minimum-order rules, stock changes, obstructing pop-ups and the mobile checkout button | Make charges clear, correct the stock rule or remove the obstruction |
| Checkouts do not become purchases | Destination coverage, final total, payment declines and required-field errors | Repair the unavailable route, failing payment or confusing field |
On a phone, swipe the table sideways to compare every column.
The numbers locate a step; they do not explain every shopper’s reason. Customer questions, payment errors and consented session recordings can provide evidence of what went wrong. Avoid assuming that every abandoned cart means the price is too high.
Use the affected customer’s conditions when checking the path. Select the same product variant, try a relevant country and address, and use the device or browser where the drop occurs. A checkout can work on your desktop while its cart drawer covers the next button on a phone.
Write down what the phone test actually shows
In Shopify, open Analytics → Reports and filter the report category to Behavior. Use the conversion breakdown and check whether Open Funnel is enabled before comparing the stages. The report names and metrics are described in Shopify’s behavior-report guide. This is a check to perform, not a test we ran in your store.
Record the visit you mean
Save the dates, sales channel, human/bot filter and source/device/country group. Note total sessions, cart sessions, checkout sessions and purchase sessions under that same scope. Separate direct-checkout entries when using a closed sequence.
Record the obstacle you saw
For an eligible destination, note the exact product option, phone/browser, cart total, available delivery method and any payment error. For example, “blue option, this destination, no shipping method shown” is an observation; “customers dislike the price” is a guess.
Verify the change
Repeat that path after fixing the confirmed error. Confirm the option, amount and delivery method are right before completing an authorized test order, and check that the purchase and supplier handoff are recorded once. Later compare equivalent traffic groups; a successful test alone does not prove conversion has improved.
Follow your payment provider’s supported test method. It may verify checkout without verifying a live charge or physical delivery. Keep those limits in the record, and do not attribute a small change in purchase count to the edit without enough evidence.
If a shipping rate is unavailable for that destination or a payment method fails, fix the confirmed obstacle first. Changing button color will not help a customer pay through a broken path.
Remember the entry rules from earlier. Someone using a direct checkout link may skip the cart step. Include them correctly in your actual reporting; the neat sequence here is an example for understanding the calculations, not a claim that every visit follows it.
05
Give shoppers enough detail to decide
A shopper needs to understand what will arrive and whether it fits the intended use. Include the real dimensions, capacity, materials, compatibility, variants and parts in the pack. Show restrictions where they affect the decision, instead of relying on a broad claim such as “premium quality.”
Take an illustrative travel-bottle listing. “Premium travel essentials” does not tell the shopper the bottle capacity, how the closure works or which accessories are included. A clear specification and a genuine product demonstration answer those questions. Only claim that it is leakproof if you have evidence supporting that claim.
Use real reviews with the necessary permissions and disclosures. If a new product has no reviews, accurate specifications, sample photos and clearly stated limitations are more useful than invented testimonials, countdowns or certifications. The dropshipping product descriptions guide covers how to turn those facts into helpful copy.
Replace “fast shipping” with the facts
Delivery uncertainty can leave a shopper unable to judge the offer. Show where you ship, when the order leaves, estimated transit, the shipping charge and the key return conditions near the buying decision. Keep the full policy accessible.
Here is hypothetical copy, assuming the supplier and store have confirmed every term. These are not AIDrop’s delivery rates or return policy.
Before: “Fast shipping. Easy returns. Buy with confidence.”
After, if the supplier and store can support these terms: “Dispatches in 1–2 business days. Estimated transit is 4–6 business days after dispatch to eligible contiguous-US destinations. Shipping is $4.95. Unused items may be returned within 30 days of delivery; the customer pays return postage. For damage or an incorrect item, contact us with the order details so we can arrange a resolution.”
The clearer version tells a shopper when the parcel leaves, how long transit is estimated to take, which destinations qualify, what shipping costs and what a return involves. The 4–6 transit days are not the whole delivery time; preparation happens first.

Write your own confirmed terms rather than copying the example. If a destination is not supported, do not promise it. For returns, establish the window, item condition, return location and who pays postage. Distinguish a change-of-mind return from damage or an incorrect item, and check whether supplier repayments can fund the remedy you offer buyers.
If you cannot confirm when an order is checked, packed and handed to the carrier, AIDrop’s auto fulfillment service can help organize those China-side steps and identify who acts when an order is held.
Send a product link, destination and your current dispatch promise, with an anonymized example of the uncertainty.
Confirm the store connection and available status updates during onboarding. You can then base the delivery explanation on the agreed process; any conversion improvement still needs to be measured in your store.
06
Test changes you can afford to keep
To decide whether more traffic is affordable, connect conversion to the cost of getting an order. Here is another illustrative calculation, assuming one order per purchase session.
Suppose each eligible landing session costs $0.60 in advertising, and an order leaves $18 after goods, fulfillment, fees and expected problems, but before ads. To cover advertising, the purchase rate needs to be:
$0.60 ÷ $18 × 100 = about 3.33%
At a 2% purchase rate, the ad cost per order is $0.60 ÷ 0.02 = $30. That is more than the $18 available. At 4%, it is $15 per order, leaving $3 for running costs and profit.
This is an ad break-even point, not a target for everyone
The 3.33% figure is this example’s ad break-even point, not a dropshipping benchmark or a complete business break-even point. Fixed costs, repeat purchases and attribution effects are outside the calculation. Cost per ad click is also not automatically cost per landing session; some clicks may not become counted store visits.
Use the same dates and traffic group for ad spend and sessions. If your orders and purchase sessions are not one-for-one, calculate cost per order with the matching order count instead, and name it clearly.
Try one change you can explain
A useful test begins with a specific reason: “Shoppers cannot see the shipping charge before adding to cart, so we will show the confirmed charge beside the delivery estimate.” That gives you something concrete to change and a relevant outcome to watch.
Verify tracking, stock and checkout first. Where traffic is sufficient, split comparable visits randomly between the versions and choose the purchase outcome in advance. Watch refunds and money left as safeguards. Avoid changing the page, price, ad audience and delivery offer together; you would struggle to tell what caused the result.
One more sale is not proof of the cause
With few orders, fix confirmed errors and missing facts first, then observe comparable visits without calling a small before-and-after difference proof. Two purchases from 100 sessions is 2%; three is 3%. One extra purchase is not enough to establish a reliable improvement.
Keep the change that leaves you with paid, delivered orders you can afford to serve. Clearer delivery terms might reduce impulsive purchases while also reducing cancellations and support work. A discount might increase purchases but consume the margin. Read the whole result instead of keeping a change solely because its dashboard percentage went up.
07
Common conversion problems
Why do shoppers add to cart but not buy?
Separate the cart-to-checkout step from checkout-to-purchase. Check the actual shipping charge, destination coverage, final total and payment path on the affected device. Use an error or customer question to choose a fix, rather than assuming all abandonments share one cause.
What if the store has visits but no orders?
Check that purchases are recorded and that the buying path works. Then review whether the traffic matches the product and whether the offer answers basic questions. A very small number of visits cannot tell you confidently which of these is responsible.
Can abandoned-checkout emails solve it?
Permission-based recovery messages can remind eligible shoppers who left a checkout. They cannot repair an unavailable shipping route, a failing payment method or unclear terms. Correct the buying path before relying on reminders.
When should I add more traffic?
After shoppers can complete the purchase, the offer is accurate and the expected order economics can support the cost. Add traffic carefully and watch its source and country mix. The useful result is more completed orders at an affordable cost, not simply more visits.
Dropshipping Marketing: A Plan from First Visit to Repeat Order
Plan dropshipping acquisition, product-page conversion and repeat sales around realistic margins. Compare channels and measure costs and

Dropshipping SEO: Build Search Pages Customers Can Trust
A practical SEO plan for dropshipping stores: map searches to the right pages, verify supplier claims, link

Dropshipping Customer Retention: Earn the Next Order After the First Delivery
A practical retention plan for dropshipping stores: meet the first-order promise, choose a relevant follow-up, and measure