
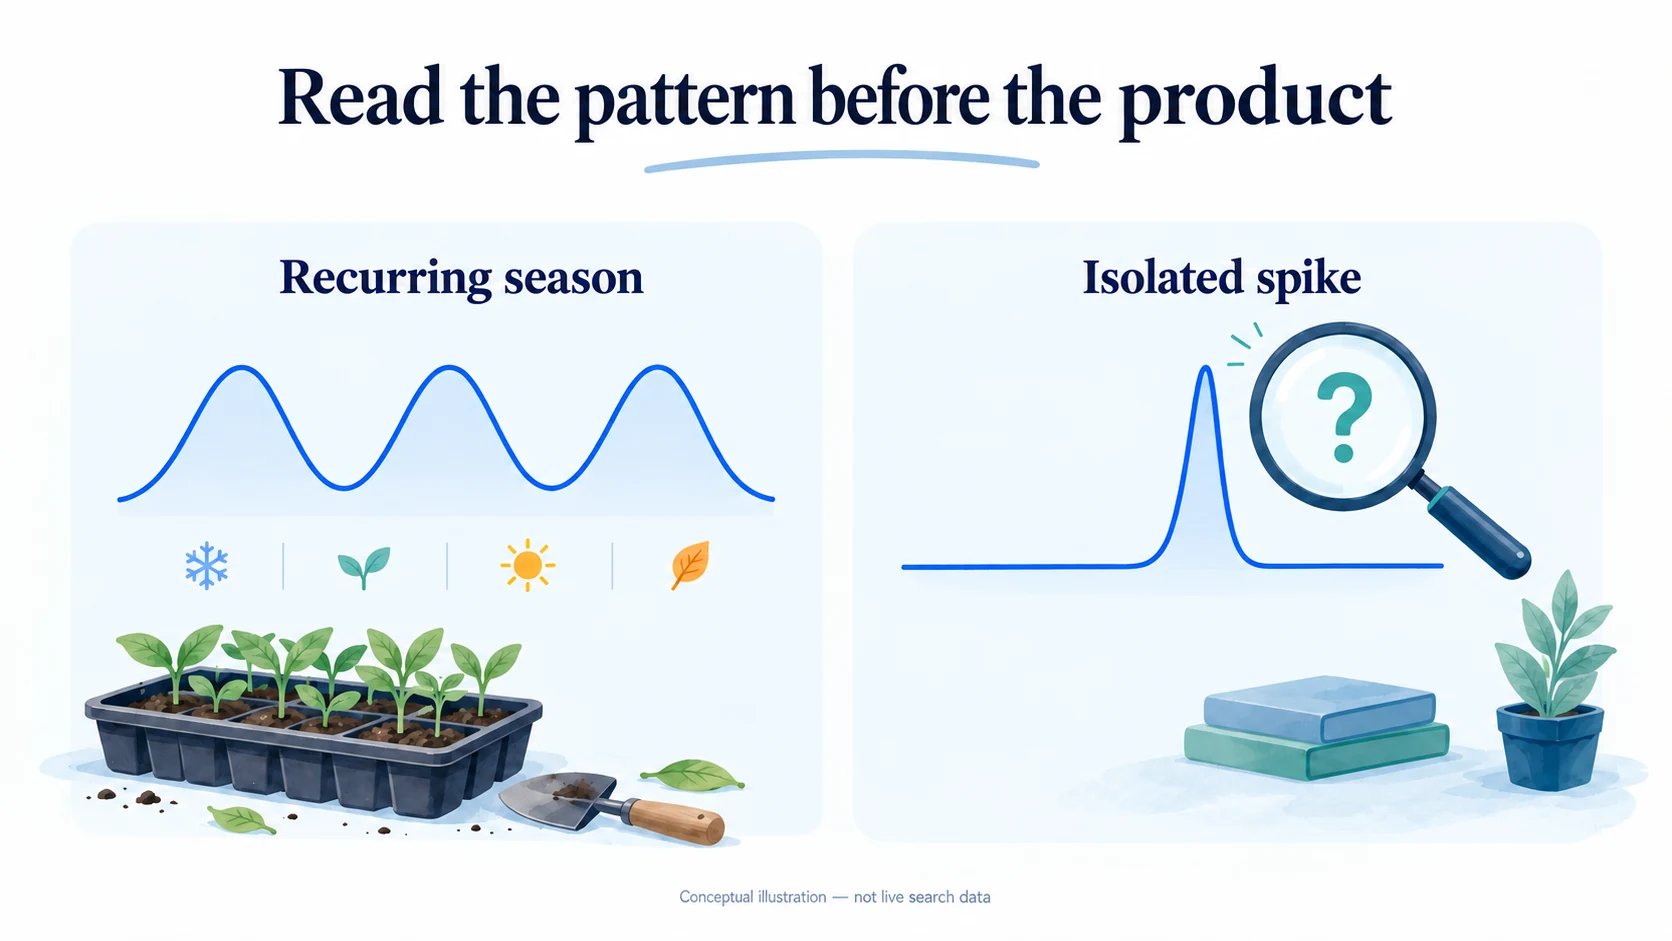
Use Google Trends to compare search interest, identify recurring seasons and understand the language people use for a product in a particular market. It can help decide what deserves further investigation and when to prepare it. It cannot tell you how many units your store will sell, which supplier will deliver them reliably or whether your offer will be profitable.
A rising line is a useful question: why are people searching now? The answer might be a buying season, a news story, a repair problem or curiosity about a viral demonstration. You need to know which before committing money.
01
Start with a product question you can investigate
Choose the intended customer, destination and use case first. “Storage products” is too broad to tell you whether a particular under-bed box deserves a test. The more practical question is whether people in your target market show recurring interest in under-bed storage, what types they seek and whether your proposed item fits that need.
Use Trends as one part of dropshipping product research. After reading the search pattern, compare actual competing offers, their delivered prices and customer complaints. Then check the proposed product, supplier and route. A category can attract attention while your particular offer remains uncompetitive.
Write down the decision before opening the tool. You might be deciding whether to prepare a seasonal item, which customer wording to investigate or whether a recent spike has lasted long enough to justify a small test. This keeps a colorful chart from becoming a substitute for a business question.
02
Understand what the numbers measure
Google Trends uses a sample of searches. It normalizes interest against all searches in the relevant time and place, then presents an index on a 0–100 scale. The peak in the selected comparison becomes 100. These are not search counts or percentages of customers who intend to buy.
Consider a simplified hypothetical example, not a Trends export. In one period, a term appears in 100 of 10,000 searches: a 1% share. In another, it appears in 150 of 30,000 searches: a 0.5% share. Its raw number of searches rose, but its share of all searches fell. This is why relative interest and absolute volume can move differently.
Changing the date range or adding a more popular comparison can rescale the chart. A value of 80 in one screenshot cannot be compared directly with 60 in a separately configured screenshot. Compare candidates together under consistent settings, and keep those settings with any exported findings.
Google’s data FAQ also explains that low-volume queries can display as zero and that statistical noise can create apparent isolated spikes, especially for low-interest terms. A zero does not prove that nobody searches, and a single spike does not establish a market.
Treat small differences and unusual low-volume jumps cautiously. Recheck the pattern over a useful period and look for corroborating evidence. Do not turn an unstable point into a claim that a product’s demand has doubled.
03
Choose between a search term and a topic
A search term is useful when you want to investigate the wording customers use. A topic groups searches associated with a concept, including different languages and variants. Read the description in the dropdown: a familiar word may refer to more than one subject.
For example, a broad topic for a product category may capture interest that your narrow product phrase misses. That helps investigate the category, but it does not mean every included search is for your exact item. Conversely, searching a supplier’s awkward catalog title can produce little data even when customers use a common everyday name for the product.
Google’s term-versus-topic guidance describes the distinction. Its advanced search lesson adds an important detail: an unquoted multiword term can include the words in different orders; quotation marks narrow the phrase, and the tool supports operators for combining or excluding words. A normal term selection should not be treated as an exact-match advertising keyword.
For an initial comparison, use terms with terms or topics with topics. If you compare a topic with a phrase, explicitly recognize that their scope differs. Otherwise, the broader definition may appear to be a stronger product simply because it includes more ways of searching.
A practical starting list for a product might include the common item name, an alternative name and the problem it addresses. Inspect them separately before combining them. You want to understand the difference, not hide it in one larger line.
04
Keep the comparison settings visible
Use the country you can serve, not worldwide data by default. If you sell into several markets, investigate them separately before making one purchasing decision. Their seasons, language and delivered offers can differ.
| Setting | What to decide | Common mistake |
|---|---|---|
| Geography | The actual country or region you intend to serve | Treating global interest as demand on your available shipping route |
| Date range | Several years for recurring patterns, then a shorter view for recent changes | Comparing separately scaled charts as though their scores were absolute |
| Search term or topic | A consistent scope for the products being compared | Giving a broad topic an unfair comparison with a narrow phrase |
| Category | Whether the word needs context to exclude an unrelated meaning | Selecting a filter merely because it creates a more attractive curve |
| Search property | Web, Shopping, YouTube or another relevant search dataset | Reading Google Shopping interest as completed purchases |
Google’s basic Trends lesson explains the indexed regional view. A region scored 100 has the highest relative interest in that view; it does not automatically contain the largest number of potential buyers. A smaller region can have a high share and fewer searches overall.
The search properties are different datasets. YouTube interest may be useful for investigating demonstrations and tutorials. Shopping searches may provide additional commercial context. Neither should be spliced into a Web Search series or interpreted as your store’s conversion rate.
Save the query, selected type, country, dates, category, property and research date with your notes. An exported chart without these details is difficult to reproduce and easy to misinterpret later.
05
Separate seasonality from a temporary spike
Begin with enough history to see several possible cycles. Look for a repeated rise in roughly the same part of the year, the period when interest begins building, and what happens after the peak. Then inspect the recent year and shorter period for changes.
Compare equivalent seasons. A seasonal item rising from winter into spring may be following its usual pattern rather than entering a new growth phase. Check the same period in previous years and consider whether the whole category has changed. Northern- and southern-hemisphere markets may require different planning calendars.
An isolated jump needs a different investigation. Search the term and related queries for the event that might explain it. A recall, celebrity mention or unusual weather event can increase attention without creating durable demand for your proposed product. A question such as “why does this break?” may reveal a design problem worth solving, but it is not the same as a purchase query.
Check whether the newest point covers a completed period. Do not compare an unfinished week with a complete week and call the apparent fall a collapse. Record the date range you actually used rather than describing the result vaguely as “trending now.”
06
Use related searches to refine the product
Related queries can expose the intended use, an overlooked size, a compatibility requirement or an alternative product. Read the query itself and the results it leads to; a rapidly rising brand name may not describe a generic item you can supply.
Google distinguishes Top searches from Rising searches. Rising describes growth against the previous comparison period. Its related-search documentation defines “Breakout” as growth above 5,000%. That is a growth label, not a statement of large absolute volume or likely profit.
Sort useful queries into questions your offer must answer. “For narrow drawers” points toward dimensions. “Replacement lid” points toward compatibility or spare parts. “How to clean” may belong in product instructions. Some queries will be informational and unsuitable for a sales campaign, while still helping improve the listing.
Do not automatically copy every rising phrase into a title. Confirm that the product really has the feature or fits the use. An interest in waterproof organizers does not justify describing a water-resistant fabric pouch as waterproof.
07
Work backwards from the season
Suppose you are investigating seedling trays for a destination market. This is a planning example, not a claim about live search trends. Imagine your own research suggests that relevant interest usually starts building in a particular month. The operational question is whether samples, stock and the customer delivery route will be ready before that period.
Write the schedule backwards from the date the customer needs the item:
- Allow the actual order-to-delivery time for the destination, including processing.
- Set the latest sensible customer order date for the seasonal use.
- Leave time before that date to run a limited offer test and learn from delivered orders.
- Allow sample review, corrections and any stock preparation before the test begins.
If those stages require eight weeks in your particular plan, discovering a peak one week before it arrives does not give you eight weeks of preparation. A supplier’s in-stock claim also needs to match the tray size, material and quantity you intend to sell.
For a short season, start with a commitment you can absorb if demand is weaker or later than expected. A strong historic curve does not remove weather variation, competing local availability or the risk of unsold inventory after the buying window.
08
Let an offer test challenge the chart
The next test should answer whether the actual audience will buy the actual offer. Show a truthful product page with its price, dimensions, delivery estimate and return conditions. Use a small, defined budget and make sure the product can be supplied before taking orders.
Here is a hypothetical test, not an AIDrop result. A page receives 600 eligible visits from a $300 campaign and records 12 paid orders. Its purchase conversion rate is 12 ÷ 600 = 2%, and advertising cost per order is $300 ÷ 12 = $25.
Suppose each order leaves $14 after product, fulfillment, payment fees and an expected exception allowance, but before advertising and overhead. Those 12 orders contribute $168 before advertising. Subtracting the $300 campaign leaves −$132 before overhead. The search pattern may still be interesting, but this offer has not yet shown workable paid acquisition economics.
The example does not establish a statistically reliable conversion rate or a permanent conclusion about the product. It identifies what to investigate: traffic relevance, price, competing offers, product fit or fulfillment cost. A cheaper click is only useful if the resulting customer can be served at a sustainable contribution.
Use the unit economics guide to set the cost limit before scaling. Read support questions, cancellations and delivered-order feedback as well as purchases. A chart and a checkout conversion do not tell you whether the product met expectations.
09
Frequently asked questions
Is Google Trends free to use for dropshipping research?
The public Trends Explore tool is free. It provides relative search interest, so you may still need other evidence for search volumes, product availability and commercial testing. Paid product-research software does not make the underlying Trends index a sales forecast.
What does a score of 100 mean?
It marks peak relative interest within the selected view or comparison. It does not mean 100 searches, 100% of people, or that the product has the highest sales in its category.
Can Google Trends tell me whether a product is saturated?
No. It measures search interest, not the number or quality of sellers competing for a customer. Inspect current offers, delivered prices, differentiation and acquisition costs separately. High interest can coexist with intense competition.
Should I reject a product that shows zero?
Not solely for that reason. The query may be too narrow, use the wrong wording or have insufficient search activity for a useful series. Try an appropriate topic or alternative customer language and inspect other evidence. Do not expand the term so broadly that it stops describing the product.
How often should I check the data?
Match the cadence to the decision. A seasonal launch needs planning before the buying window and a review as it approaches. A short-lived spike may need closer investigation. Reopening the chart daily does not add much when your supplier, price and offer remain untested.