
Dropshipping profit margin is profit divided by net sales, multiplied by 100. The useful question is which costs you deducted: gross margin subtracts the cost of goods sold, contribution margin subtracts variable costs, and net margin accounts for the business’s remaining expenses. A product’s high gross margin can therefore coexist with a store losing money.
To judge your own margin, start with sales after discounts and refunds, deduct the costs required to earn those sales, and decide how much profit must remain. The calculation below follows 100 assumed orders through that process, including what happens when a discount, refund increase, or higher advertising cost changes the result.
01
What is a good dropshipping profit margin?
A good margin covers the costs included in your calculation, leaves enough profit for your business, and survives the changes you reasonably expect. A percentage without a cost definition cannot tell you whether an offer meets those conditions.
Published ranges need care. For example, Shopify’s dropshipping overview cites margins of 10–15% for open-marketplace sourcing and 20–50% for some supplier networks. Those ranges describe different sourcing arrangements; they are not a verified promise of after-tax profit for your store. Do not use them as a substitute for your own expense records. Shopify’s dropshipping overview
Instead, set a target with a clear meaning: “We want to retain 10% of net sales before income tax and financing costs, after advertising and our stated overhead.” That is an illustrative planning target, not a recommended industry minimum. A different business may need a higher target to pay its owners, fund product development, or absorb uncertain returns.
Check both dollars and percentages. A 20% margin on $20 of net sales leaves $4; a 10% margin on $100 leaves $10. Neither number shows the required labor, risk, or cash commitment by itself. For the broader operating costs behind an order, see the dropshipping unit economics guide.
02
Keep gross margin, contribution, net margin, and markup separate
Use the same sales period and cost definitions throughout your calculation. In this article, net sales means sales after discounts and refunds. The examples exclude sales tax collected for remittance and assume no separate customer-paid shipping charge.
| Measure | Calculation | What it tells you |
|---|---|---|
| Gross margin | (Net sales − cost of goods sold) ÷ net sales × 100 | What remains after the costs classified as goods sold |
| Contribution margin | (Net sales − all variable costs) ÷ net sales × 100 | What remains to cover fixed costs and profit |
| Net profit margin | Net income ÷ net sales × 100 | What the business retains after all applicable expenses, including income tax |
| Markup percentage | (Selling price − chosen cost basis) ÷ chosen cost basis × 100 | How much price exceeds that cost basis |
Gross margin and contribution margin answer different questions. Selling expenses can fall outside cost of goods sold while still varying with each order. Contribution includes those variable expenses. Use your accounting policy consistently when classifying shipping, handling, and other costs. AccountingCoach’s explanation of gross and contribution margin
Markup also has a different denominator. If the chosen cost is $20 and the selling price is $50, the $30 difference is a 150% markup and a 60% margin against that cost. The selling price is 2.5 times cost. None of those figures tells you the profit left after advertising, payment fees, or overhead.
When using a calculator, read its cost fields before trusting its “net profit” label. If it subtracts only order-level costs, the result may still need to pay for subscriptions, staff, professional services, and other fixed expenses.
03
A worked calculation for 100 orders
These are illustrative USD assumptions, not AIDrop Agent client results or market averages. Assume one product per order, a $50 regular price, and a 10% discount that brings the amount charged to $45. All 100 orders ship, and five are later fully refunded.
Each order costs $18 for the product and $6 for outbound shipping. Assume a processing fee of 3% plus $0.30 on every original payment, with none of that fee returned. Advertising costs $10 per order. Each refunded order adds $10 of handling or other unrecovered return expense. There is no supplier credit or recoverable inventory value. Fixed overhead for this modeled period is $300.
The 3% plus $0.30 fee is a calculation assumption, not a quoted payment-provider rate. Actual refund treatment also depends on the payment method and agreement; a processor can retain the original processing fee after a refund. Stripe’s refund fee explanation
Here is where the money goes across those 100 orders.
| Item | Calculation | Amount |
|---|---|---|
| Sales after the discount, before refunds | 100 × $45 | $4,500 |
| Refunds | 5 × $45 | −$225 |
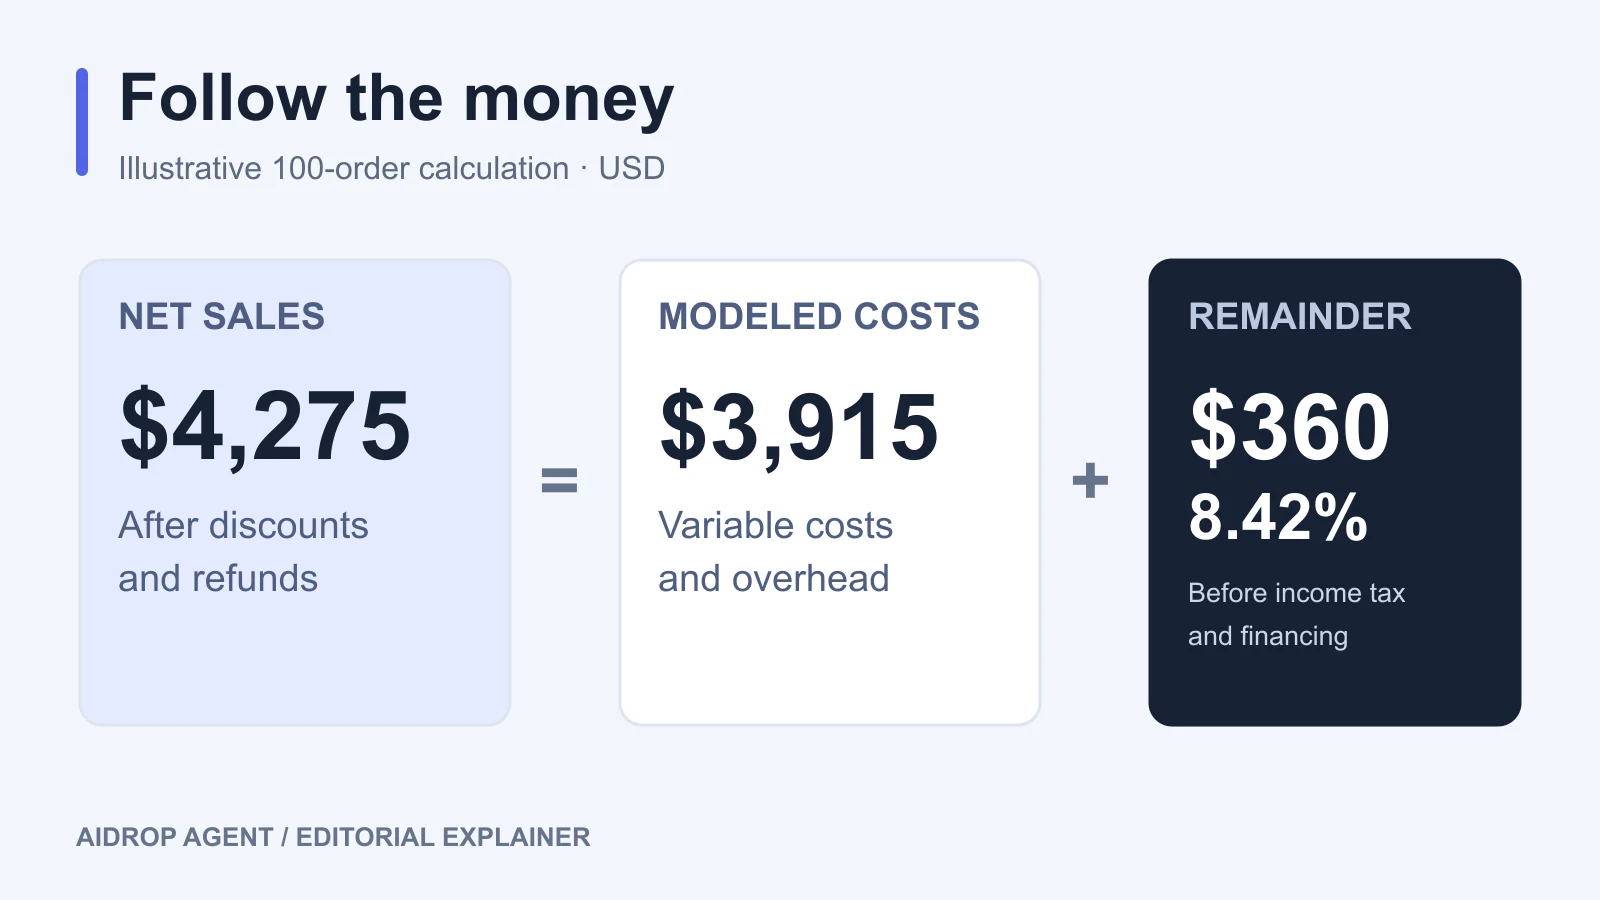
| Net sales | $4,500 − $225 | $4,275 |
| Product costs | 100 × $18 | −$1,800 |
| Outbound shipping | 100 × $6 | −$600 |
| Processing fees | 100 × ($45 × 3% + $0.30) | −$165 |
| Advertising | 100 × $10 | −$1,000 |
| Additional return expense | 5 × $10 | −$50 |
| Contribution after variable costs | Net sales minus the five expense lines above | $660 |
| Fixed overhead | Assumed cost for this period | −$300 |
| Profit before income tax and financing costs | $660 − $300 | $360 |
The contribution margin is $660 ÷ $4,275 × 100, or 15.44%. After the modeled overhead, the remaining profit is $360 ÷ $4,275 × 100, or 8.42% of net sales. It is a pre-tax result, not final net income. Any owner compensation or other business expense absent from the assumed $300 overhead would reduce it further.
For comparison, treating only the $1,800 product cost as cost of goods sold would show a 57.89% gross margin. That is a deliberately narrow cost classification for this illustration. It explains how an attractive product margin can leave much less for the business once shipping, fees, advertising, and overhead are included.
Notice that refunds reduce sales once. The product and outbound shipping costs remain for all 100 shipped orders because this example assumes they cannot be recovered. The additional $50 is separate return expense; it does not include the $225 already refunded. In your own records, account for supplier credits, recoverable stock, partial refunds, and reshipments according to what actually happened.
04
A small discount can remove much of the profit
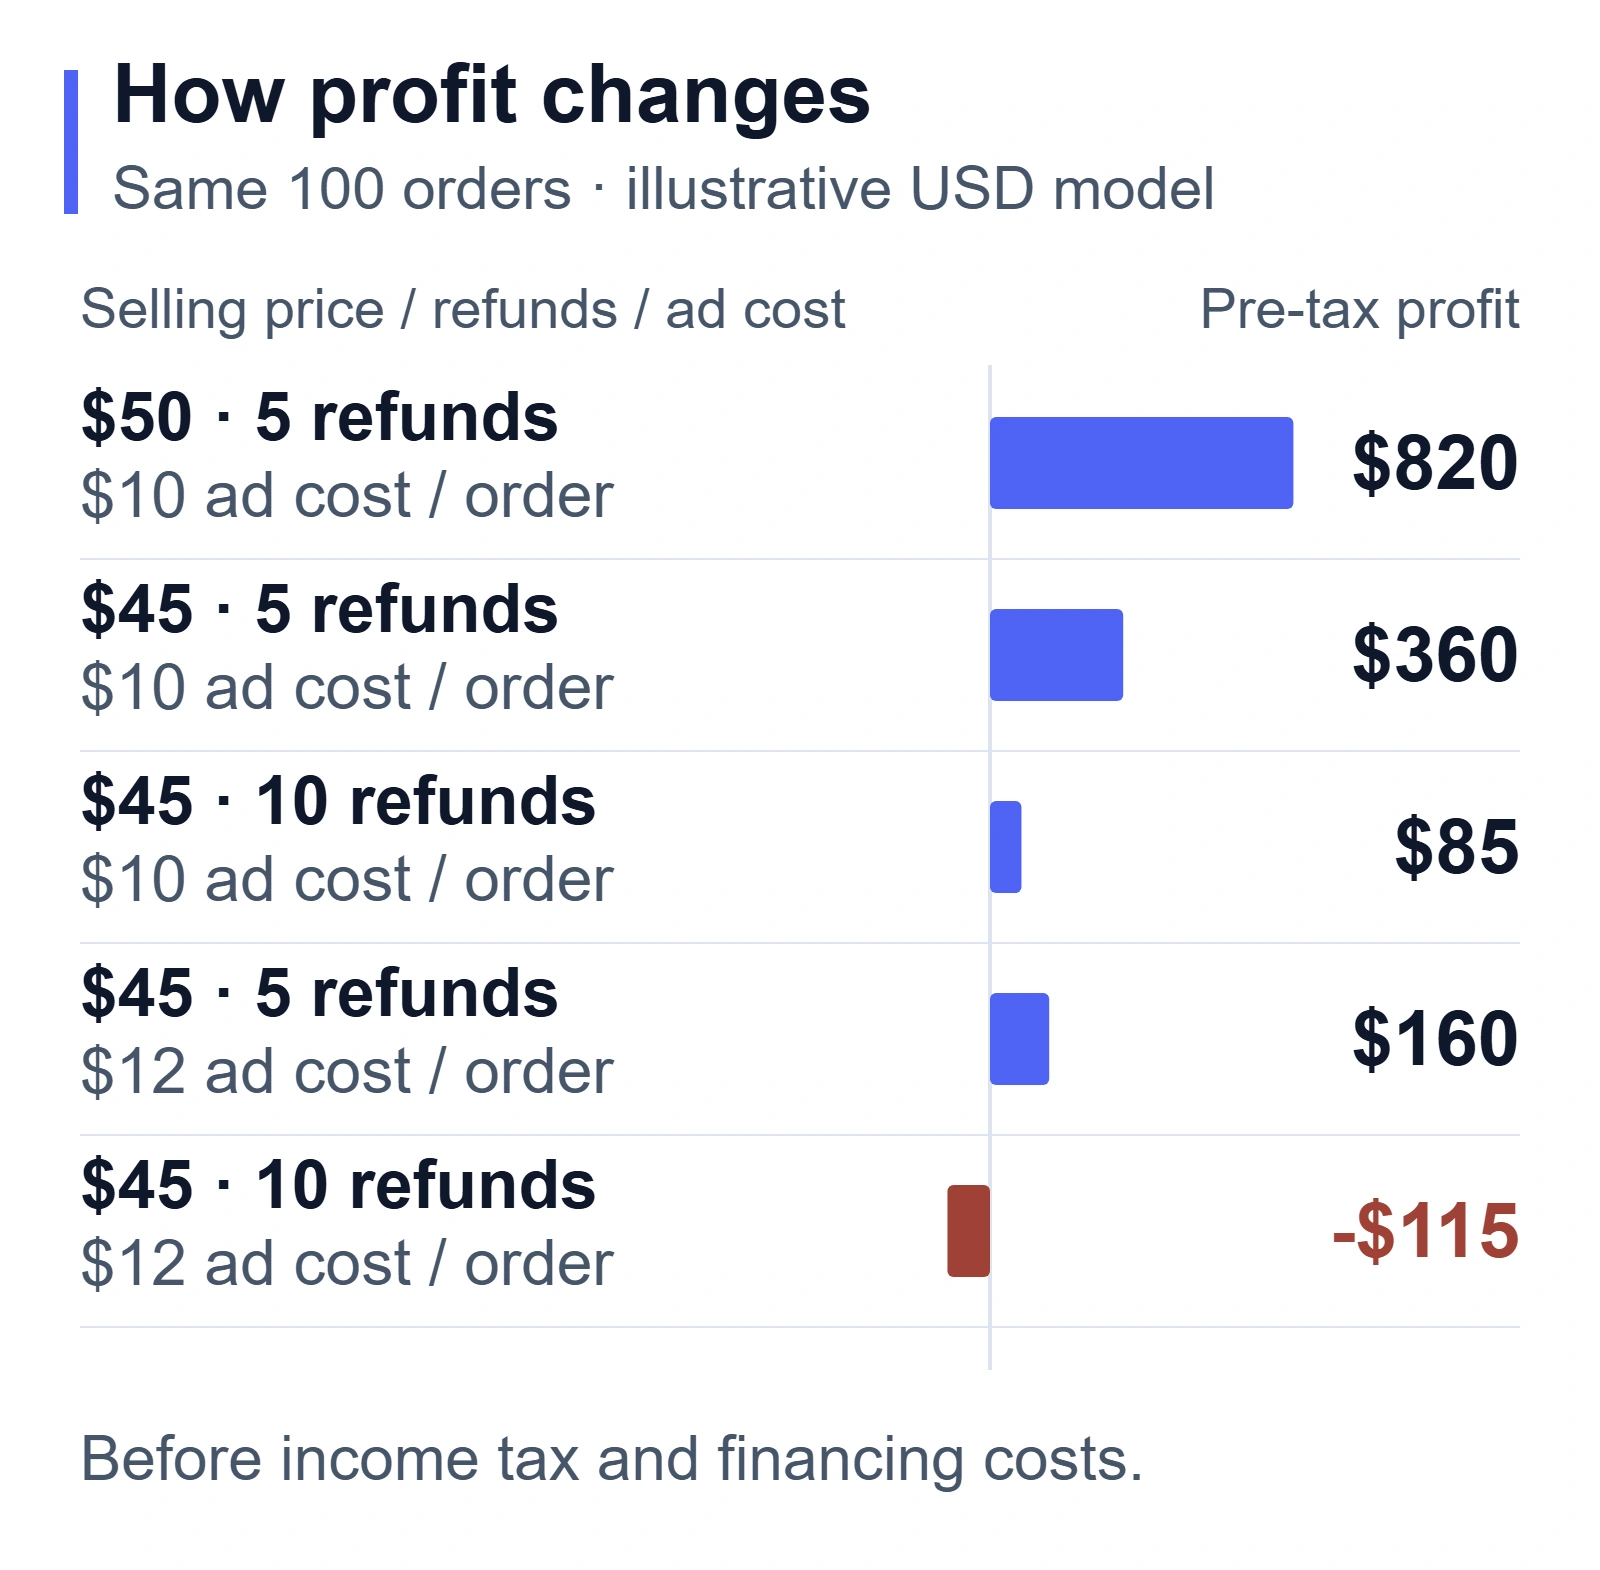
Hold the 100-order volume and all other assumptions constant. At the full $50 price, the model earns $820 before tax and financing. At $45, it earns $360. The 10% discount reduces modeled profit by $460, or about 56%.
The loss is slightly less than the $500 discount given across the orders because the refunded amounts and percentage-based processing fees also fall. Product costs, outbound shipping, advertising per order, and fixed overhead do not change in this comparison.
| Scenario for the same 100 orders | Net sales | Profit before tax and financing | Margin on net sales |
|---|---|---|---|
| $50 price; 5 refunds; $10 ad cost per order | $4,750 | $820 | 17.26% |
| $45 price; 5 refunds; $10 ad cost per order | $4,275 | $360 | 8.42% |
| $45 price; 10 refunds; $10 ad cost per order | $4,050 | $85 | 2.10% |
| $45 price; 5 refunds; $12 ad cost per order | $4,275 | $160 | 3.74% |
| $45 price; 10 refunds; $12 ad cost per order | $4,050 | −$115 | −2.84% |
This is a sensitivity comparison, not a forecast of customer behavior. A discount might improve conversion or change the basket mix. To judge the promotion, add evidence about those changes rather than assuming the extra orders will compensate for the lower earnings per order.
Refunds deserve the same treatment. In the discounted example, one additional full refund removes $45 of revenue and adds $10 of return expense, costing another $55 under the stated assumptions. Five extra refunds therefore reduce the result by $275. If refunds keep rising, connect the repeated reason—such as product expectations, damage, or delivery problems—to a corrective action using the dropshipping risk management guide.
05
Calculate the advertising cost your target allows
There are at least three different spending limits in the discounted example. Confusing them can make an advertising campaign look acceptable while it misses the business’s profit target.
Before advertising, the 100 orders leave $1,660: the $660 contribution shown above plus the $1,000 advertising expense. That is $16.60 per original order available for advertising, fixed costs, and profit.
Spending the full $16.60 per order on ads would leave nothing for fixed overhead. After reserving $3 per order for the assumed $300 overhead, the pre-tax break-even ad cost is $13.60 per order. This limit depends on the modeled order volume; allocating the same fixed costs across fewer orders would reduce it.
Now suppose the chosen target is to retain 10% of net sales before income tax and financing. Net sales per original order are $4,275 ÷ 100 = $42.75. The target profit is therefore $4.275 per original order.
Maximum ad cost per order = $16.60 − $3 − $4.275 = $9.325.
Rounded down to cents, use $9.32 in this model. The current $10 ad cost is below the $13.60 break-even limit but above the amount that preserves the 10% target. It produces the 8.42% result in the ledger.
For your own calculation, subtract the fixed-cost allocation and desired profit from the amount left before advertising. If the answer is negative, the offer fails the chosen target even with no ad spend. Recheck price and costs before assigning an acquisition budget.
Here, ad cost per order is cost per acquisition of an order, often reported as cost per purchase or CPA. Customer acquisition cost, or CAC, instead uses newly acquired customers as its denominator and can include acquisition spending beyond media. They coincide in this simplified example only if all 100 orders are first purchases from 100 new customers and the advertising budget is the entire acquisition cost. Keep repeat purchases separate when applying the result to your store.
ROAS also needs a stated revenue basis. At the $1,360 advertising budget that leaves this model at pre-tax break-even, $4,500 of sales before refunds implies a 3.31× ROAS. Using $4,275 after refunds gives 3.14×. These are two descriptions of the same calculation. Compare a platform’s reported ROAS only after checking whether its revenue, refund treatment, and attributed orders match yours.
06
Why Shopify's margin may differ from your calculation
Shopify’s Gross profit by product report uses net sales and the recorded product costs. Product variants need cost information at the time of sale to appear in the relevant profit calculation. A missing cost record can therefore leave gaps; a reassuring percentage is not proof that every order was included. Shopify’s profit report documentation
Shopify also explains that a product’s displayed margin can differ from its reported gross margin after discounts or refunds. Its order and market profit reports contain additional cost and charge fields, so check the specific report you are reading rather than assuming every profit screen measures the same thing.
Reconcile that report with supplier invoices, shipping charges, payment statements, advertising spend, and business expenses. Use a consistent currency and period. Review older order groups after returns have had time to appear; recent sales with few recorded refunds are still an incomplete view of their eventual result.
Cash in the bank is another measure again. A payout arriving later, a supplier payment made earlier, or a refund processed next month changes cash timing without making a simple dashboard margin a complete account of profit.
07
Improve the cost that is actually reducing your margin
Start with the amount and reason for the shortfall. In the discounted example, the store needs $67.50 more profit to reach its 10% target: $427.50 desired profit minus $360 achieved. That can come from a combination of better pricing, lower acquisition cost, or lower operating losses. The calculation does not establish which change customers or suppliers will accept.
A genuine $1 reduction in cost across all 100 orders adds $100 to this modeled result, provided it introduces no new expense or loss. A cheaper product that causes more refunds may fail that test. Compare supplier offers on the same specification, packaging, shipment destination, and service scope; the pricing and quote guide explains which details to clarify before comparing the totals.
Then examine discounts and returns by product and channel. Stop applying a blanket discount simply because one product can afford it. Where repeat customers cost less to serve or acquire, verify their actual contribution before using expected repeat purchases to justify a loss on the first order.
The next useful record is a completed period with identifiable invoices, fees, refunds, and acquisition costs. Replace the assumptions above with those records, state your target, and calculate the spending limit again when the offer changes.
08
Frequently asked questions
Is a 50% gross margin good for dropshipping?
It may leave room for other costs, but it is not enough information to judge profitability. On $40 of net sales, a 50% gross margin leaves $20 before expenses outside cost of goods sold. Whether that covers advertising, selling costs, overhead, and the desired profit depends on the actual amounts.
Can I leave advertising out if customers come from organic traffic?
Use the costs incurred for that channel. There may be no paid-media expense on a particular order, but content production, affiliate payments, staff, and tools can still cost money. Classify those expenses consistently instead of treating the entire channel as free.
Should I average the margin percentages of my products?
Calculate the combined margin from combined profit divided by combined net sales. A simple average gives a low-volume product the same weight as a high-volume one. For example, $20 profit on $100 of sales and $90 profit on $900 of sales produce $110 ÷ $1,000 = 11% overall, not the 15% simple average of their 20% and 10% margins.